The full picture
behind every price
Analyst consensus, price targets, financial ratios, margins, insider trades and U.S. macro indicators — everything you need to understand what drives a stock, directly inside ATdesdecero.
View plans →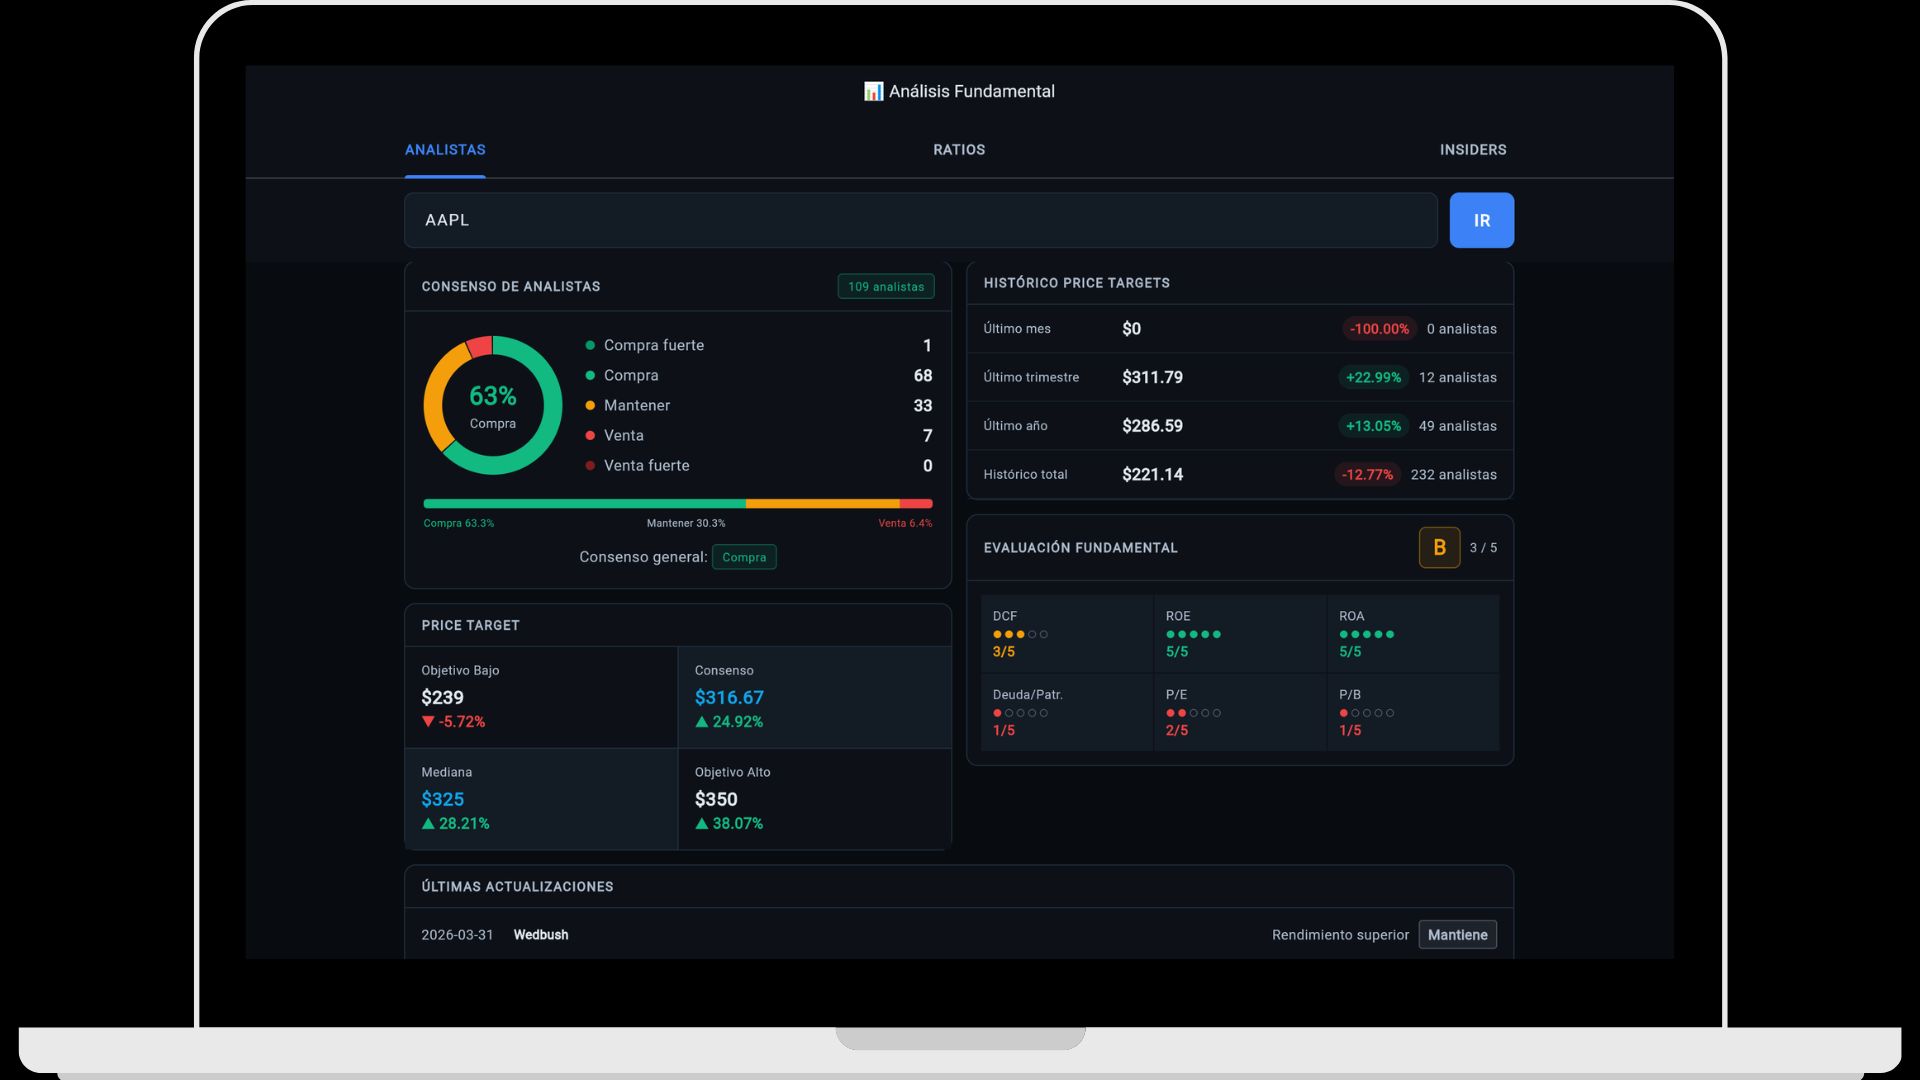
What Wall Street thinks about a stock
See the full analyst rating distribution — strong buy, buy, hold, sell and strong sell — along with aggregated price targets showing low, median, consensus and high projections.
- Rating distribution with percentage per category
- Historical price target tracking: last month, quarter, year and all-time
- Fundamental score across DCF, ROE, ROA, Debt/Equity, P/E and P/B
- Latest analyst updates with firm name and recommendation
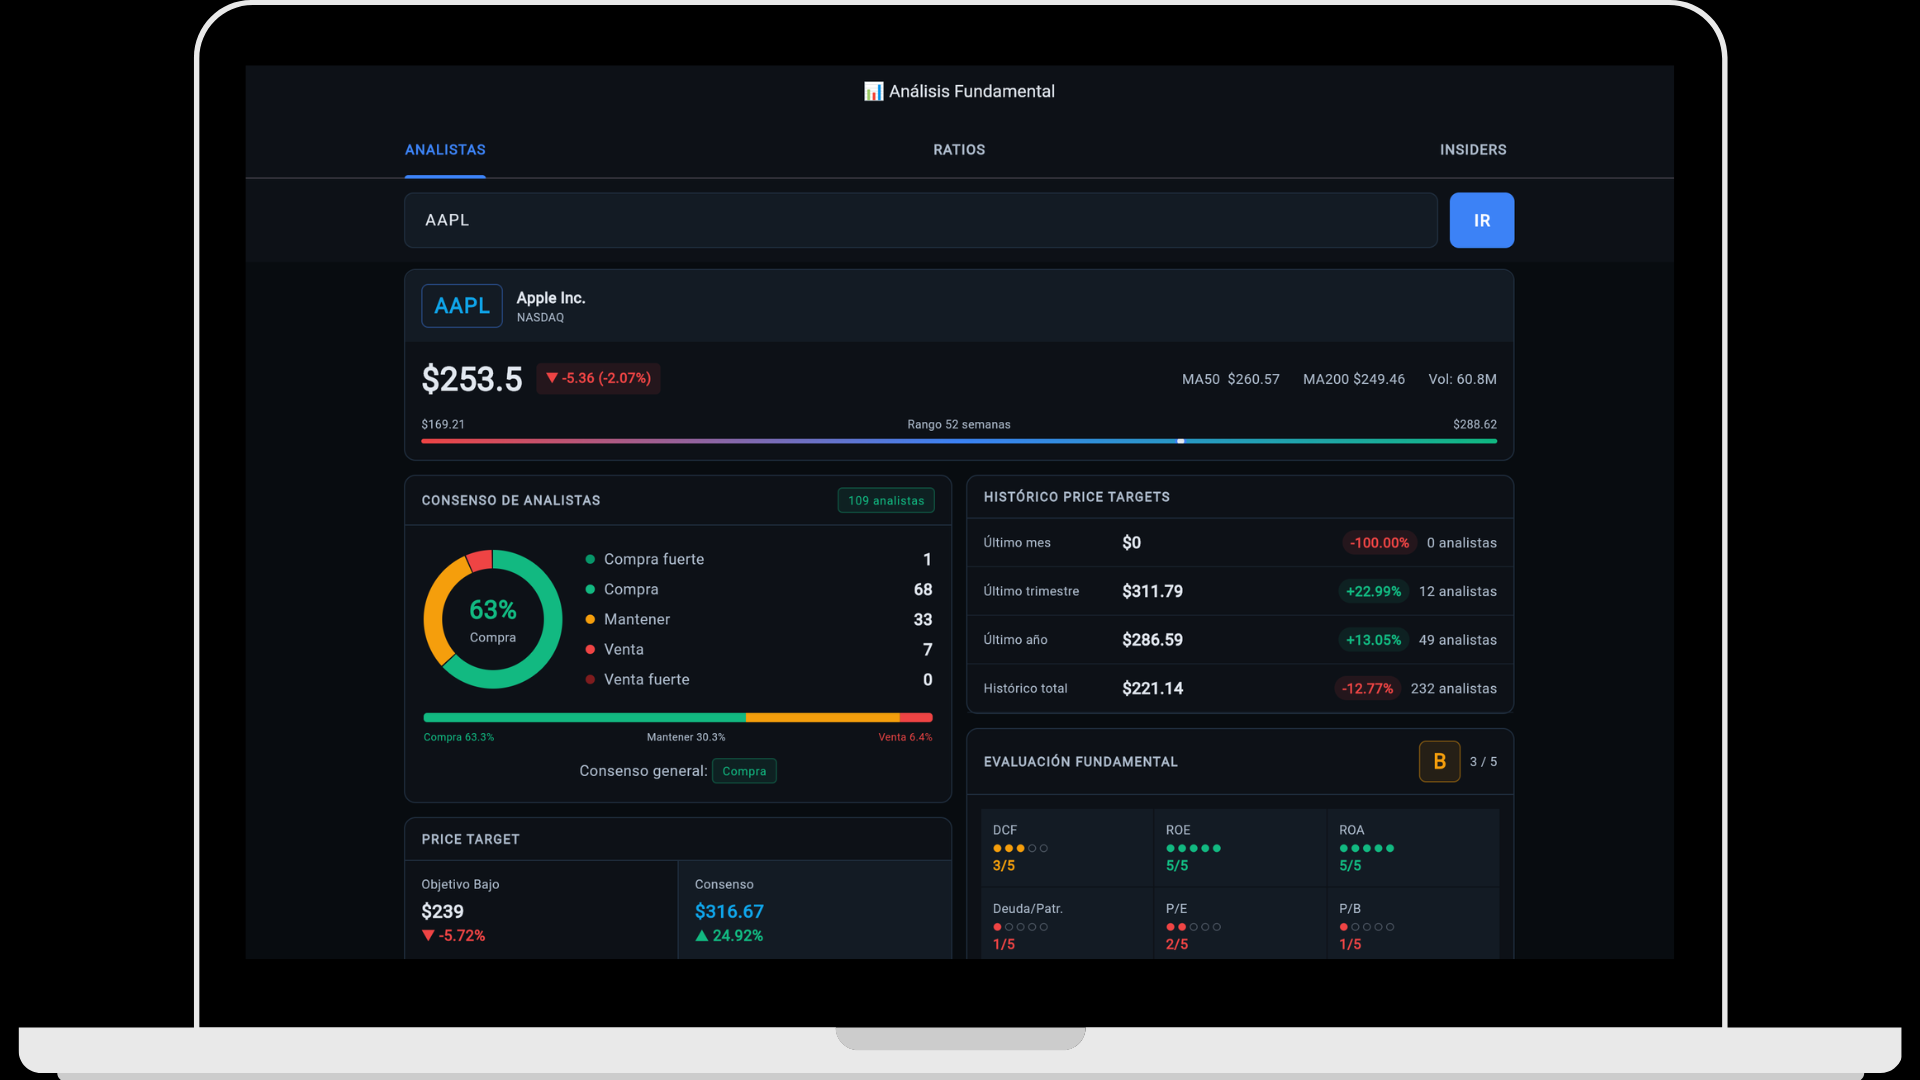
Price, technicals and fundamentals in one screen
The full view combines live price data — 52-week range, MA50, MA200 and volume — with analyst consensus and price targets on the same screen. No tab switching to get the complete picture.
- Current price with visual 52-week range indicator
- MA50, MA200 and daily volume at a glance
- Analyst consensus integrated alongside price context
- Detailed price targets: low, consensus, median and high
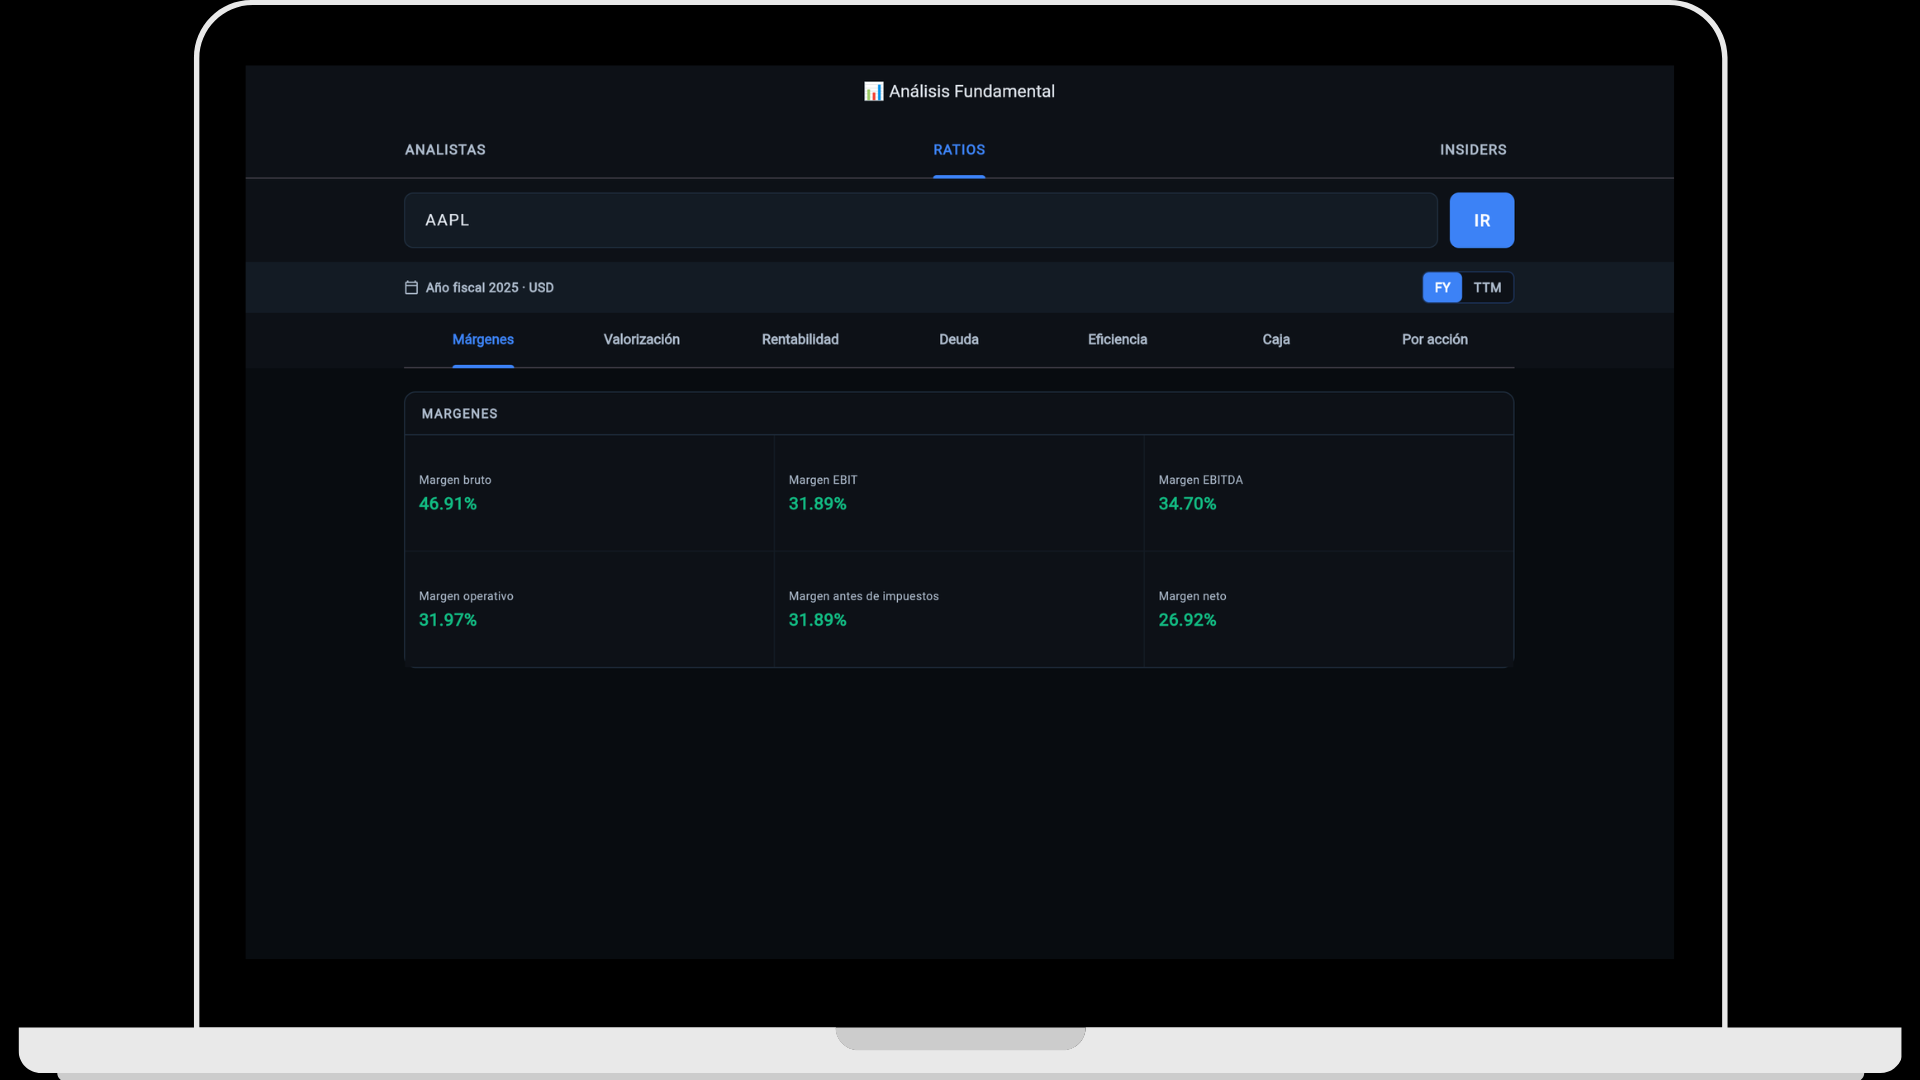
Every metric that matters, organized by category
Margins, valuation, profitability, debt, efficiency, cash and per-share metrics — organized in clear tabs with support for both fiscal year (FY) and trailing twelve months (TTM).
- Margins: gross, EBIT, EBITDA, operating, pre-tax and net
- Valuation: P/E, P/B, EV/EBITDA and derived ratios
- Profitability: ROE, ROA, ROIC
- FY/TTM toggle to compare annual vs. trailing period
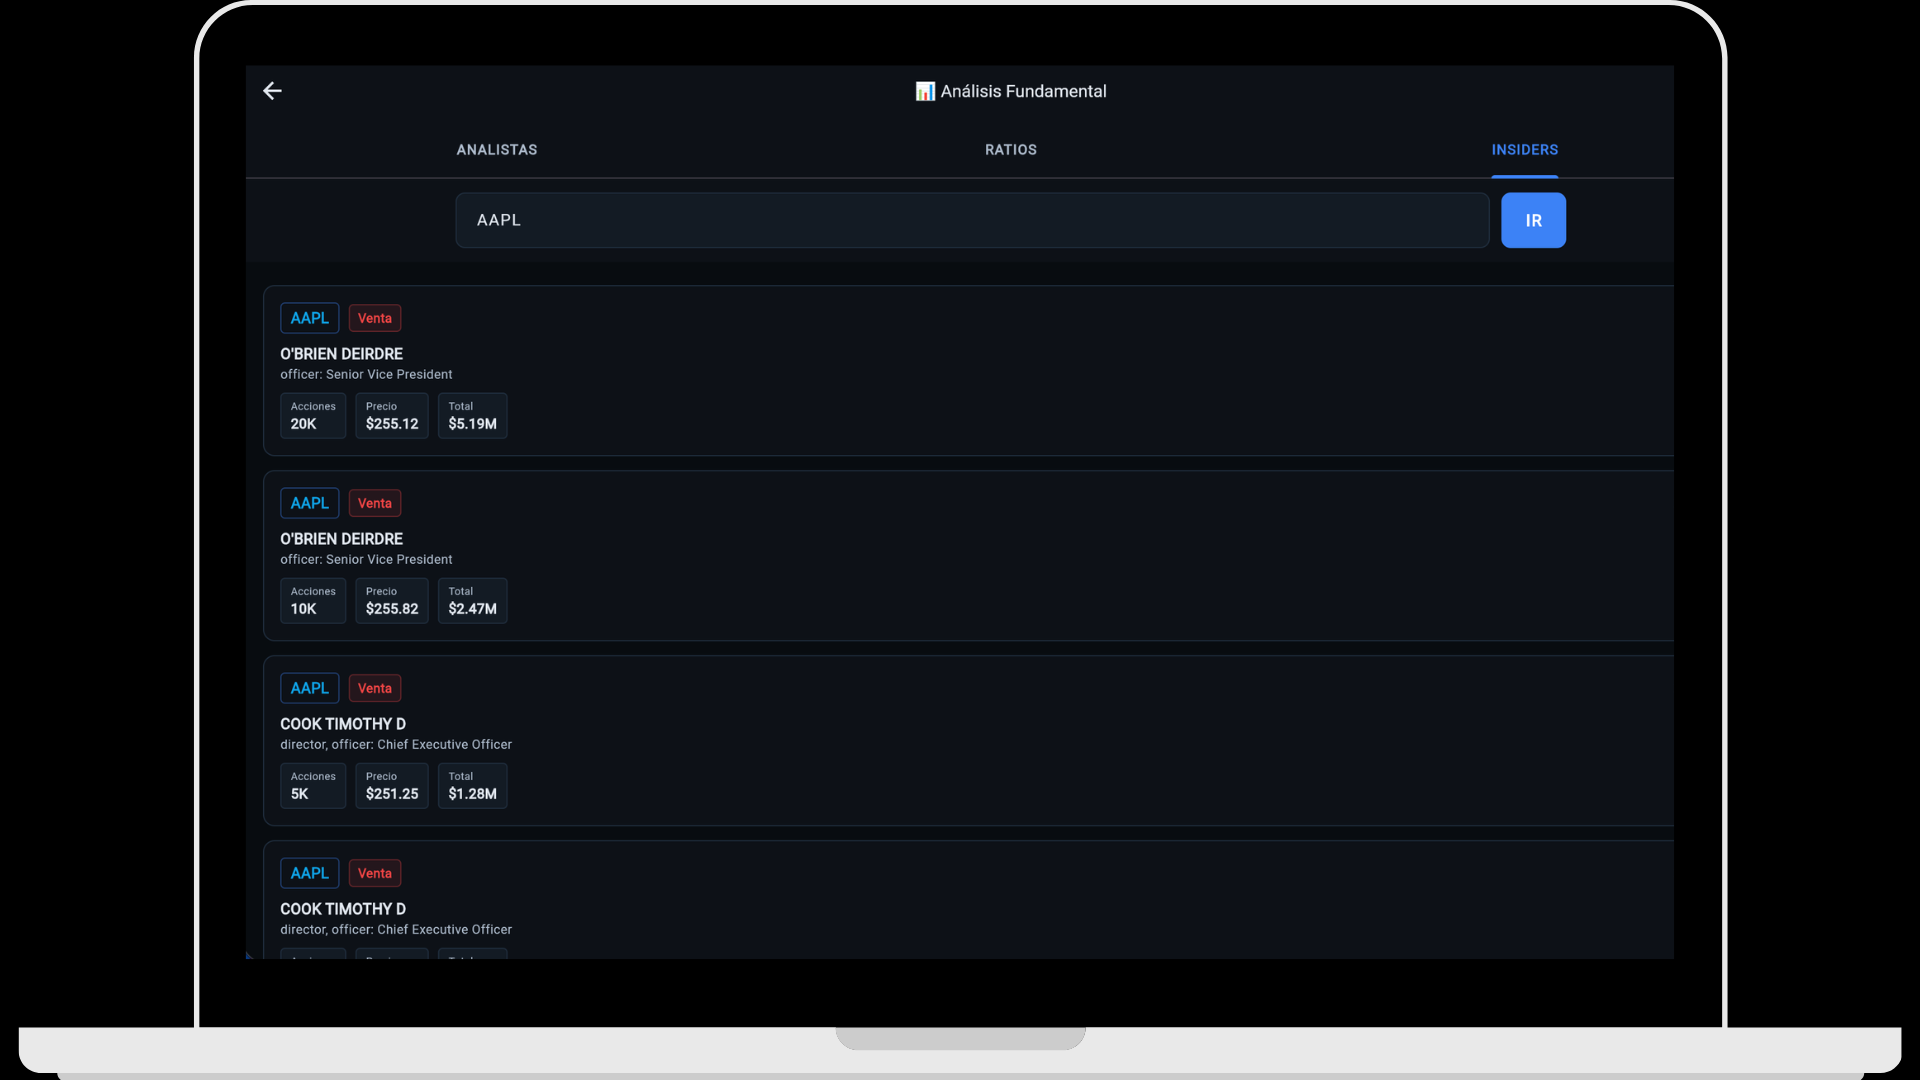
Know when executives are buying or selling
Track buy and sell transactions from directors, officers and major shareholders. Each record shows name, role, transaction type, number of shares, price per share and total amount.
- Officer and director transactions with full role identification
- Transaction type (buy/sell), shares, price and total value
- Recent insider activity sorted by date
- Available for stocks with public SEC filings
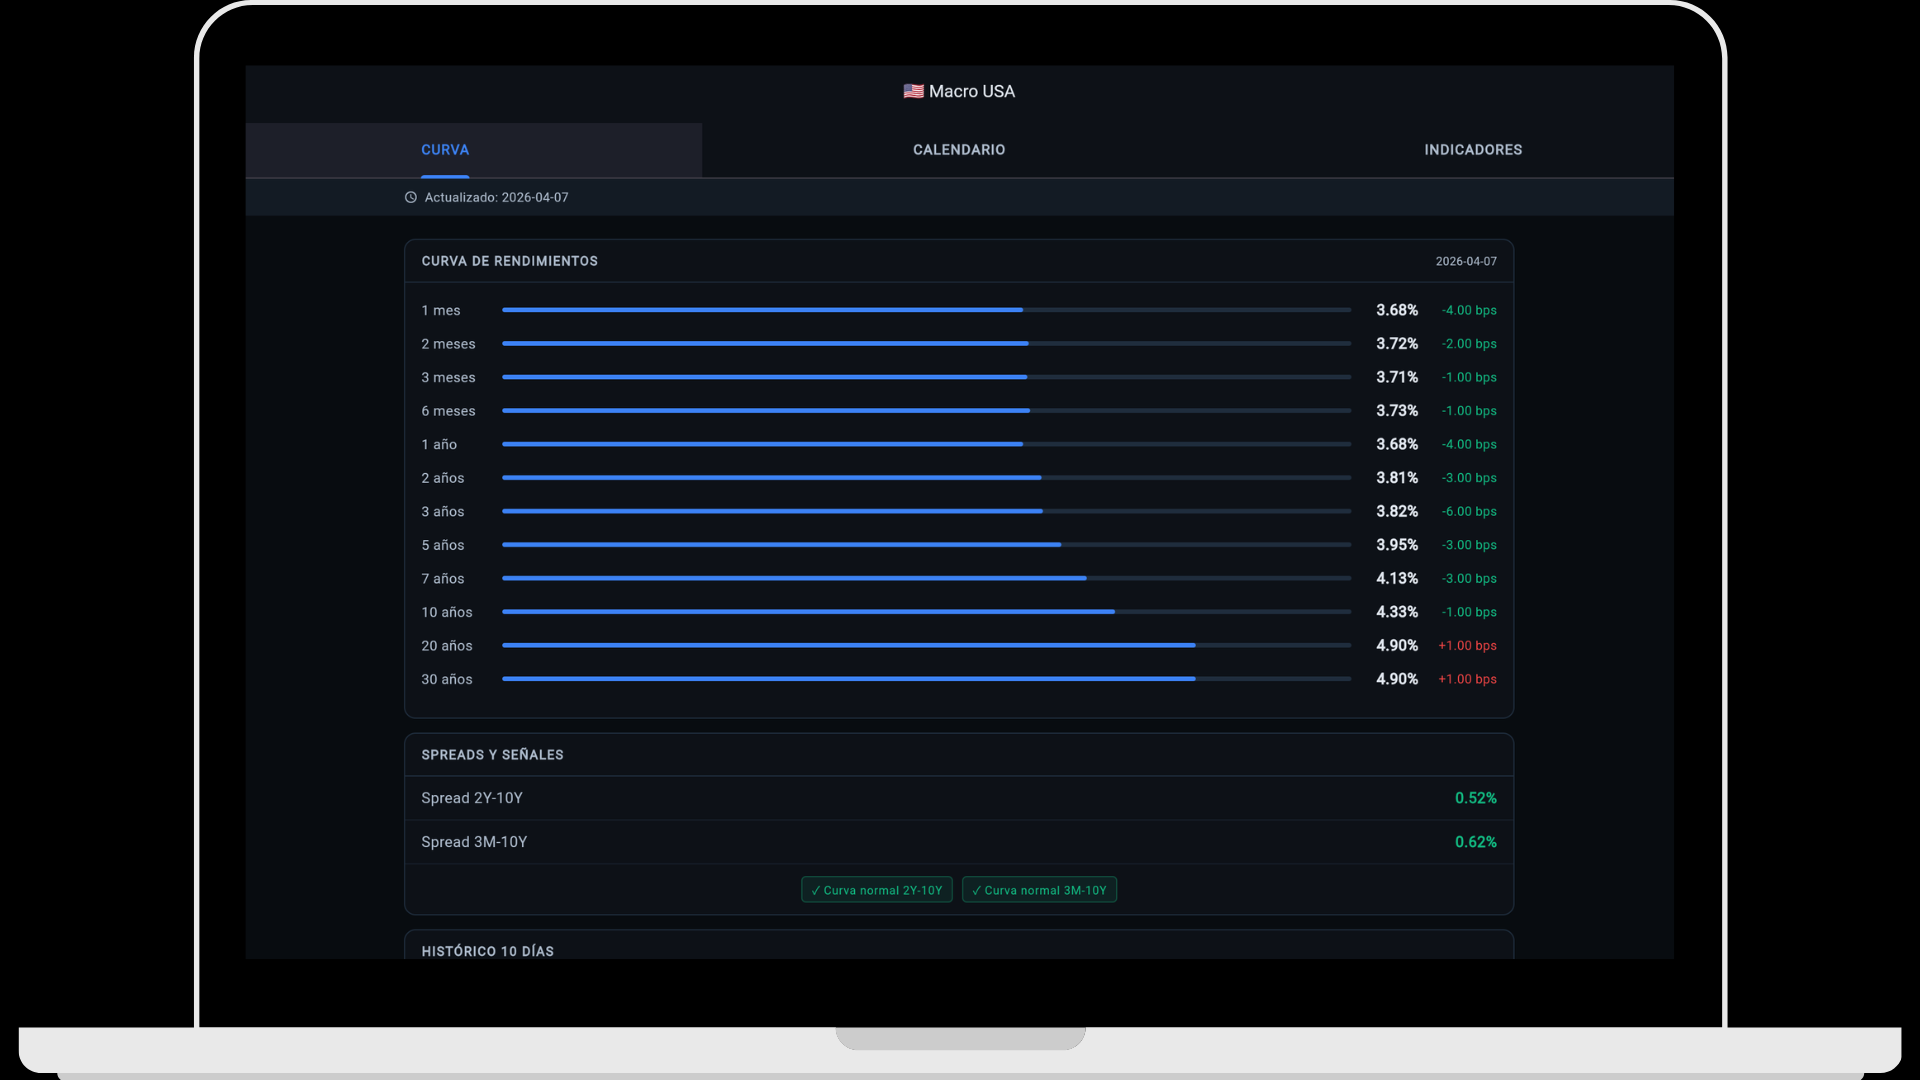
The interest rate structure in real time
Follow the U.S. Treasury yield curve across all maturities from 1 month to 30 years, including daily changes in basis points and the key spreads that anticipate the economic cycle.
- Yields for all maturities: 1M, 2M, 3M, 6M, 1Y, 2Y, 3Y, 5Y, 7Y, 10Y, 20Y and 30Y
- Daily change in basis points for each maturity
- 2Y-10Y and 3M-10Y spreads with normal or inverted curve signal
- Recent historical data to track the latest evolution
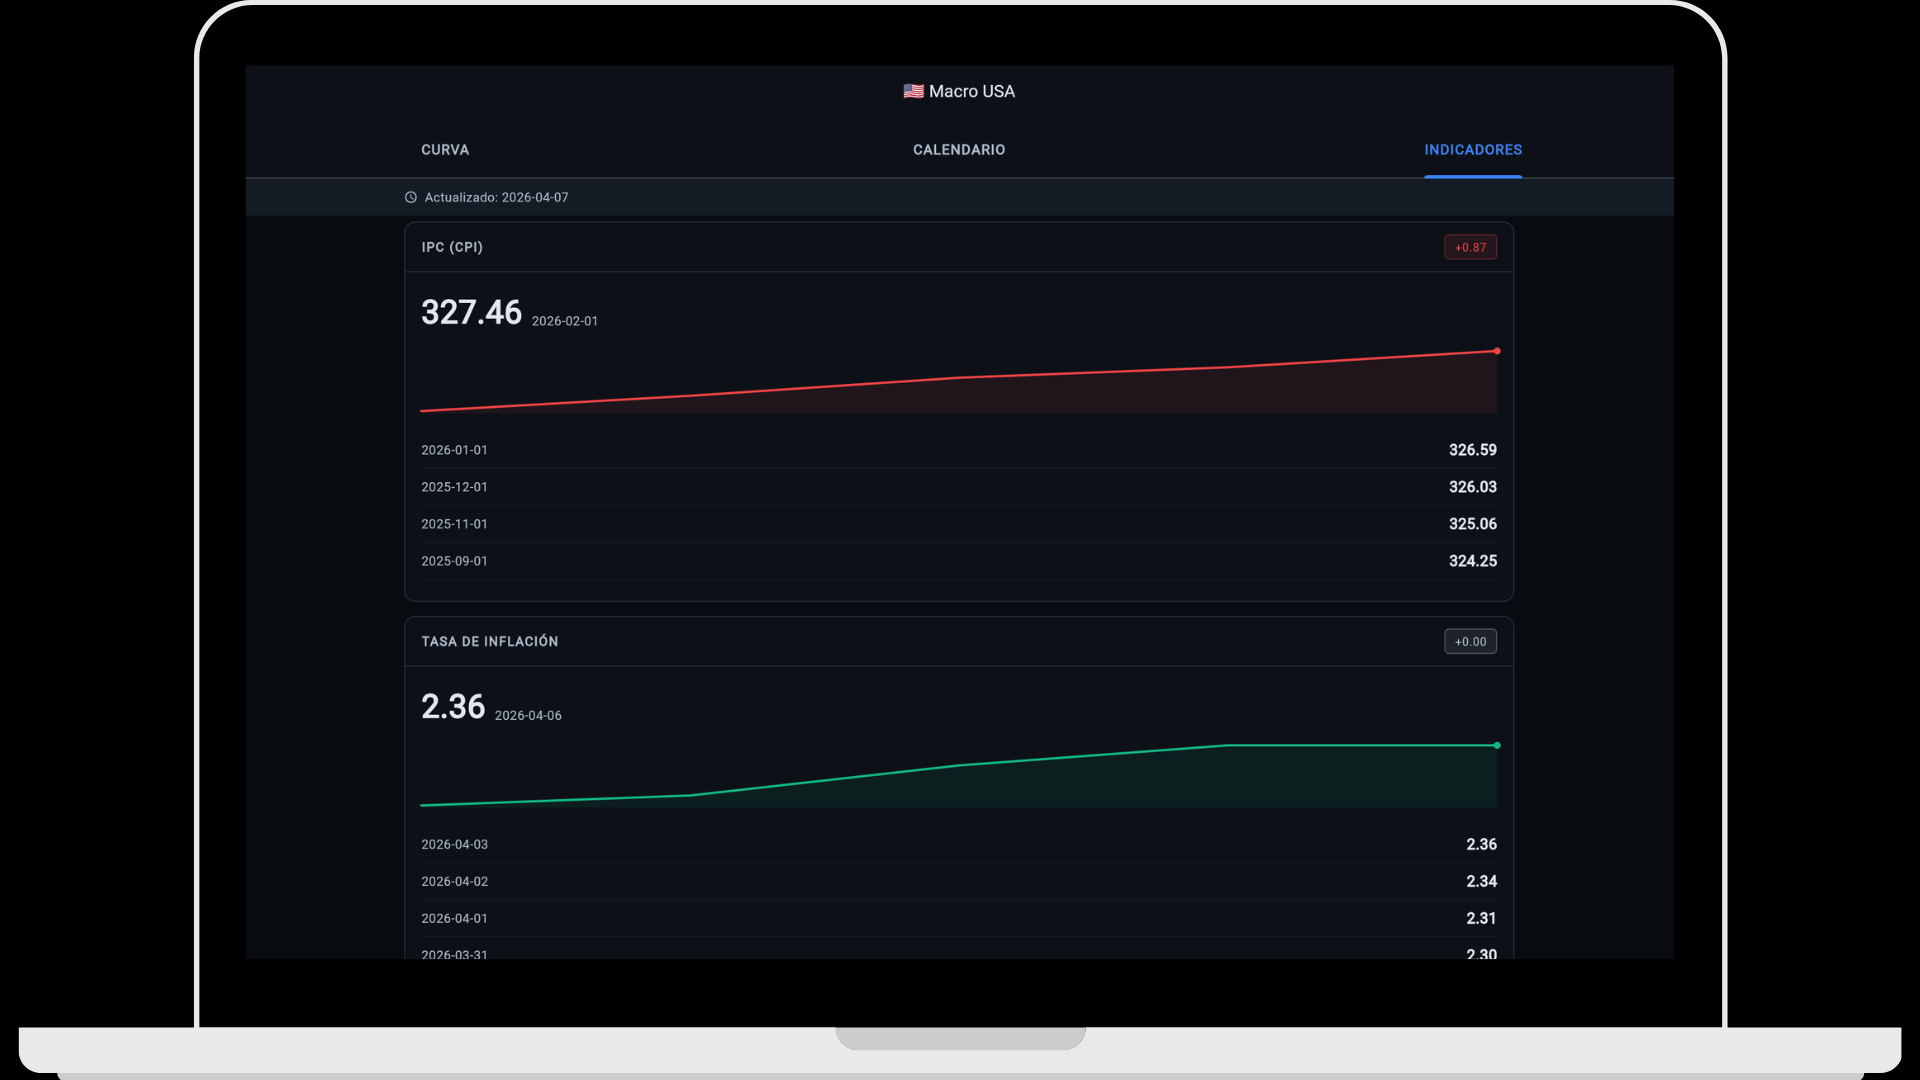
The indicators that move the market
Access the key U.S. macroeconomic indicators with visual historical data and the latest readings. CPI, inflation and other critical indicators of the American economic cycle, updated with each release.
- CPI with monthly history and change versus prior period
- Inflation rate with historical series and visual trend
- Economic calendar with upcoming releases
- Complements options flow analysis with the macro context behind price
What you need to know
Fundamentals, macro
and options flow
All the data you need to trade with full context, in a single platform.