U.S. Options Market
Options data
in real time
Gamma structure, institutional flow, delta dominance and more. The full U.S. options chain with minimum latency.
View plans →Provider ThetaData Terminal
Latency < 15 sec
Market U.S. · NYSE · CBOE
Coverage SPX · QQQ · Stocks
Not just for options traders
Options mechanics
drive the stock market
Market makers who sell options must hedge their exposure by buying or selling the underlying asset. That hedging activity generates real flows in stocks and ETFs that move price regardless of any fundamental or conventional technical factor.
Knowing the gamma structure, key levels and delta flow in real time allows you to anticipate where the market is likely headed before that move becomes visible on the chart. Not as a prediction — but as an understanding of the mechanism that drives it.
Gamma Flip as dynamic support and resistance
Above the Gamma Flip, dealers buy dips and sell rallies, dampening moves. Below it, they do the opposite — they amplify. The level is not arbitrary: it's where the real market dynamic shifts.
Delta flow moves the underlying
Every time a trader buys puts or calls, the market maker who sells them hedges their delta in the underlying. That accumulated flow is visible in the NDF and typically precedes price moves.
Useful for any trader or investor
It doesn't matter if you trade stocks, ETFs, futures or hold no options position at all. Gamma structure and delta flow give you context on the likely behavior of the market in the current session.
Available indicators
Everything you need
to trade with context
to trade with context
Each indicator is built for a specific purpose. From the market's gamma structure to the net institutional delta flow.
Available on all plans
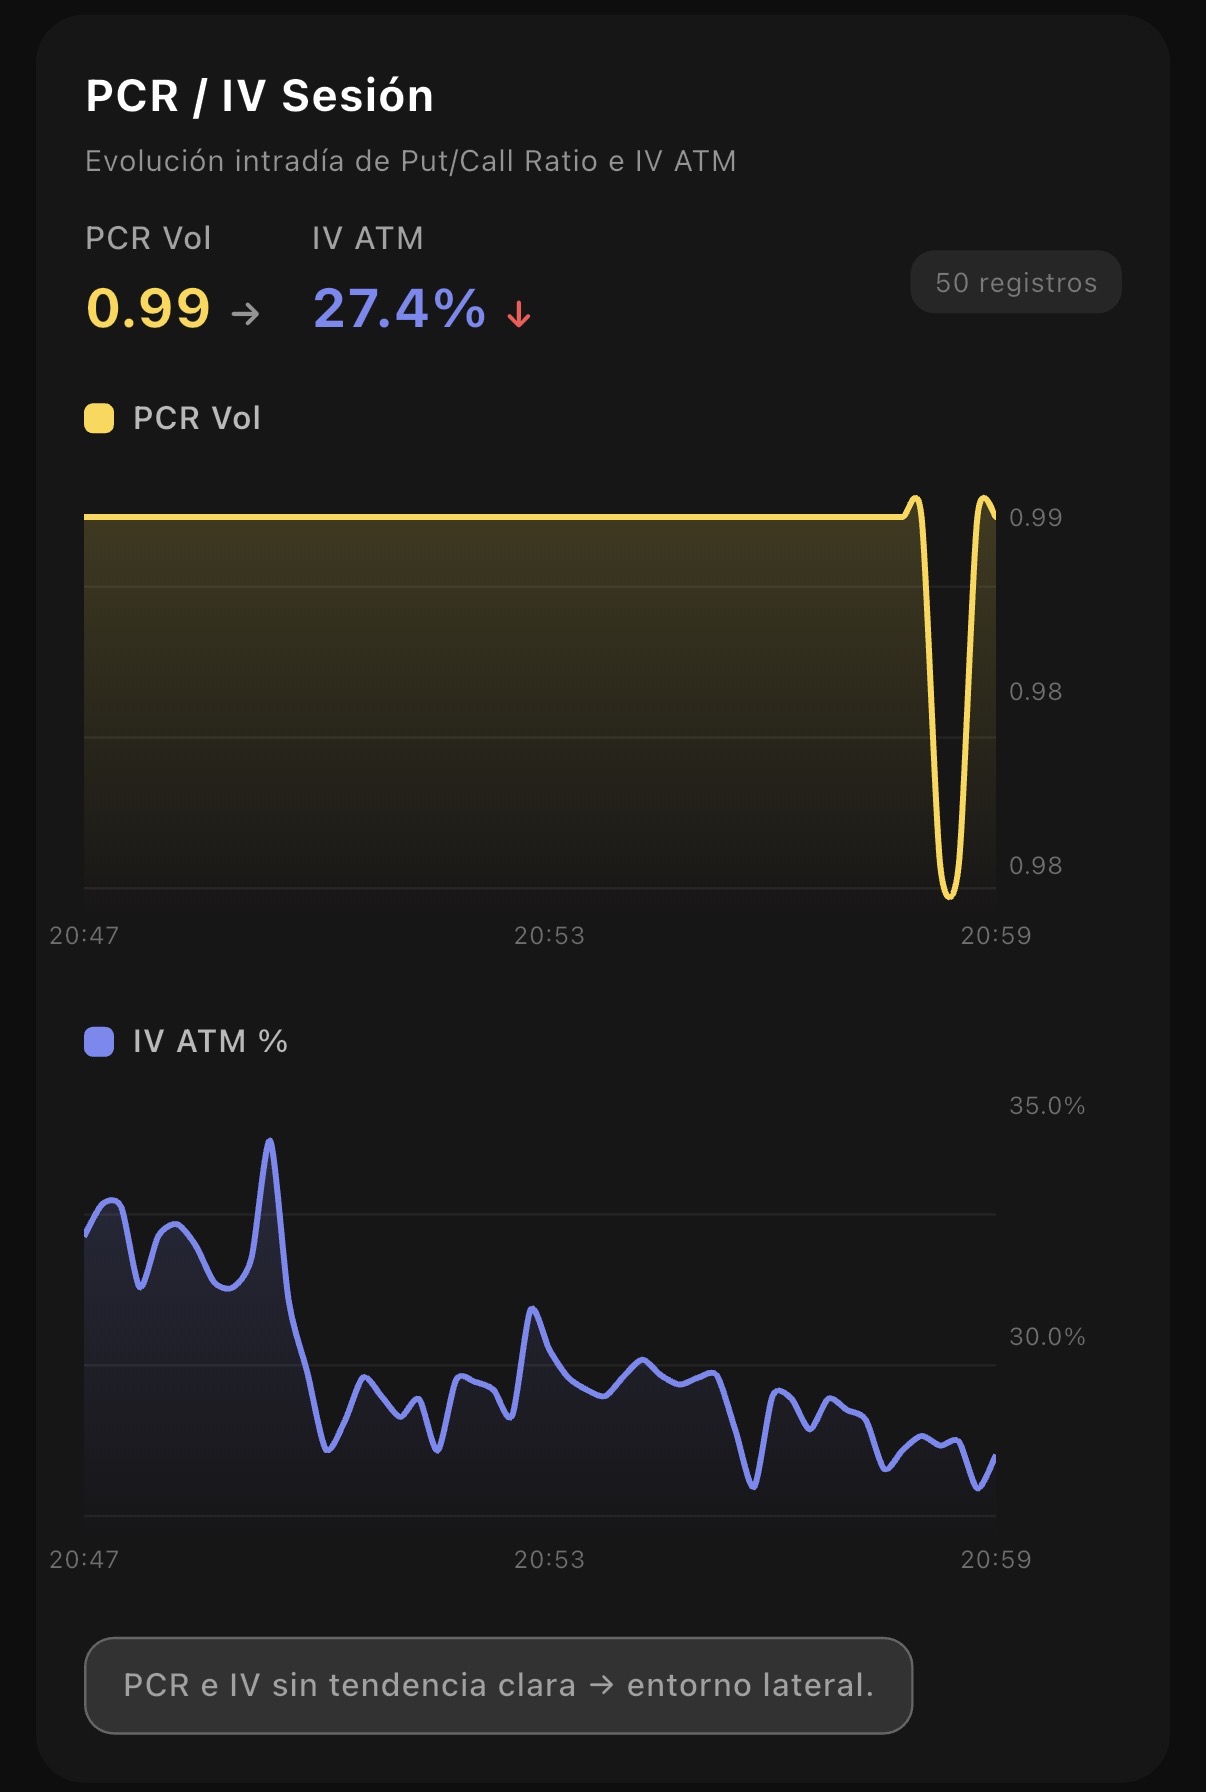
PCR & IV Session
Put/Call Ratio · Implied Volatility ATM
Intraday evolution of the Put/Call ratio and ATM implied volatility. Detects the directional bias of the options market and volatility regime shifts during the session.
- PCR Vol chart with minute-by-minute evolution
- IV ATM in real time for volatility market readings
- Automatic signal: trending or range-bound environment
Available on all plans
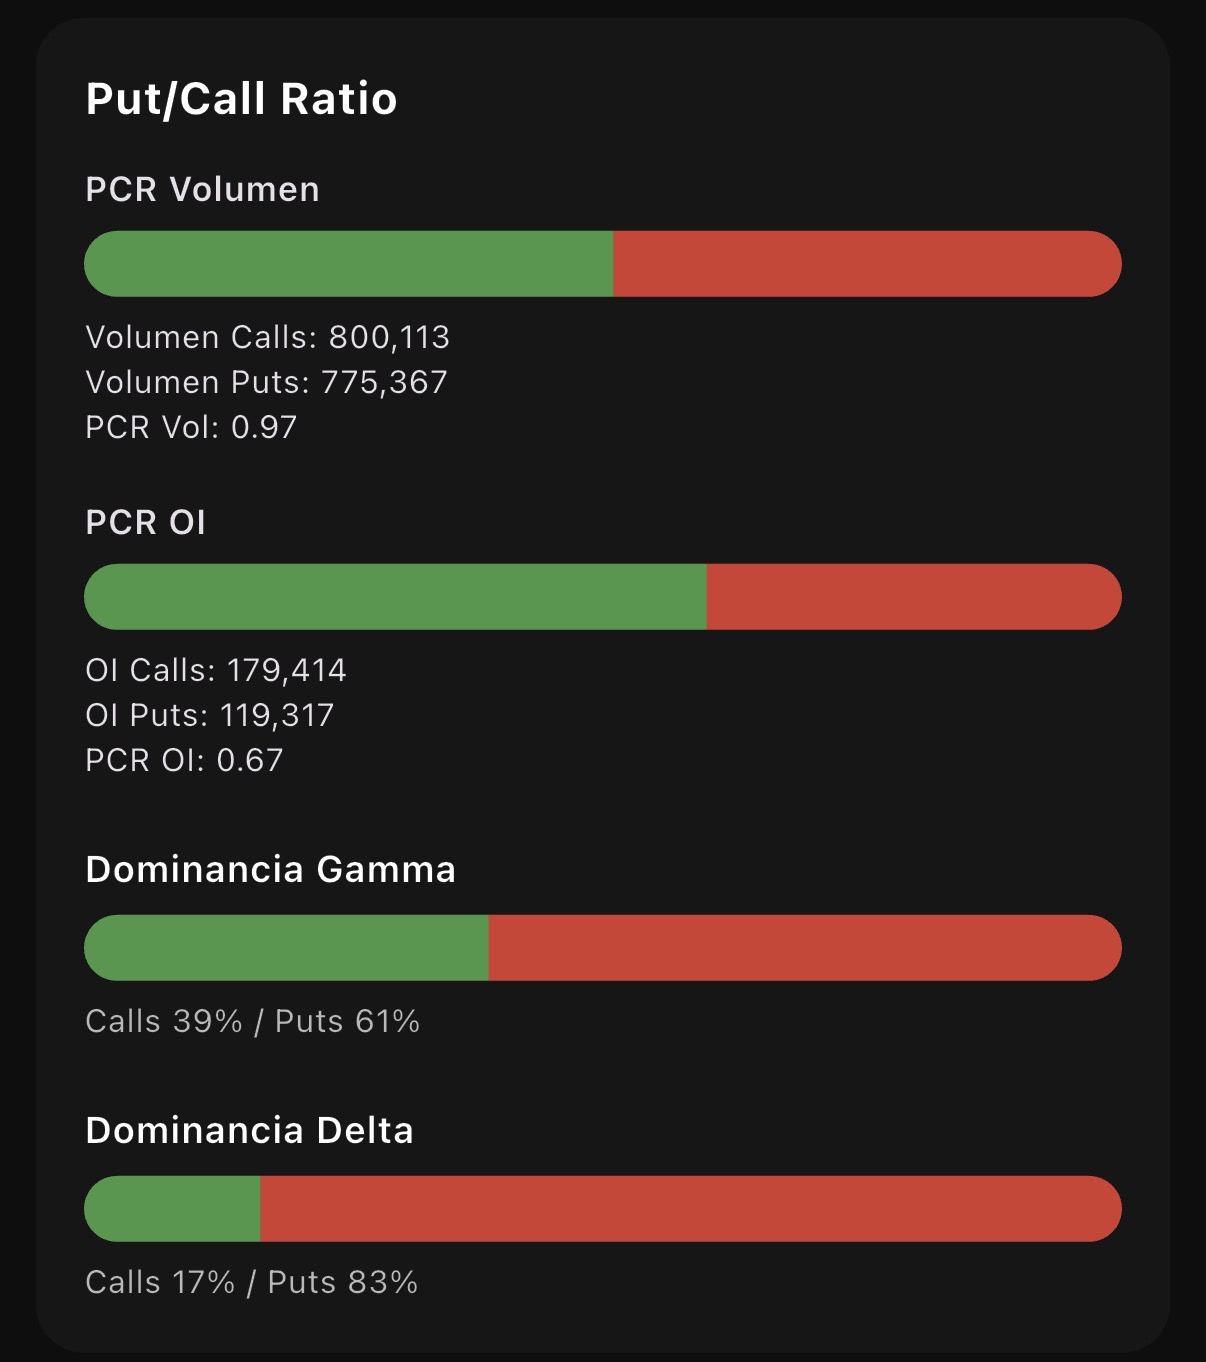
Gamma & Delta Dominance
PCR OI · PCR Vol · Gamma Dominance · Delta Dominance
Consolidated view of the calls/puts balance from four angles: volume, open interest, gamma exposure and delta exposure. Structural market bias at a glance.
- PCR Volume and PCR OI in real time
- Gamma Dominance: calls vs puts percentage in GEX
- Delta Dominance: accumulated directional pressure
Available on all plans
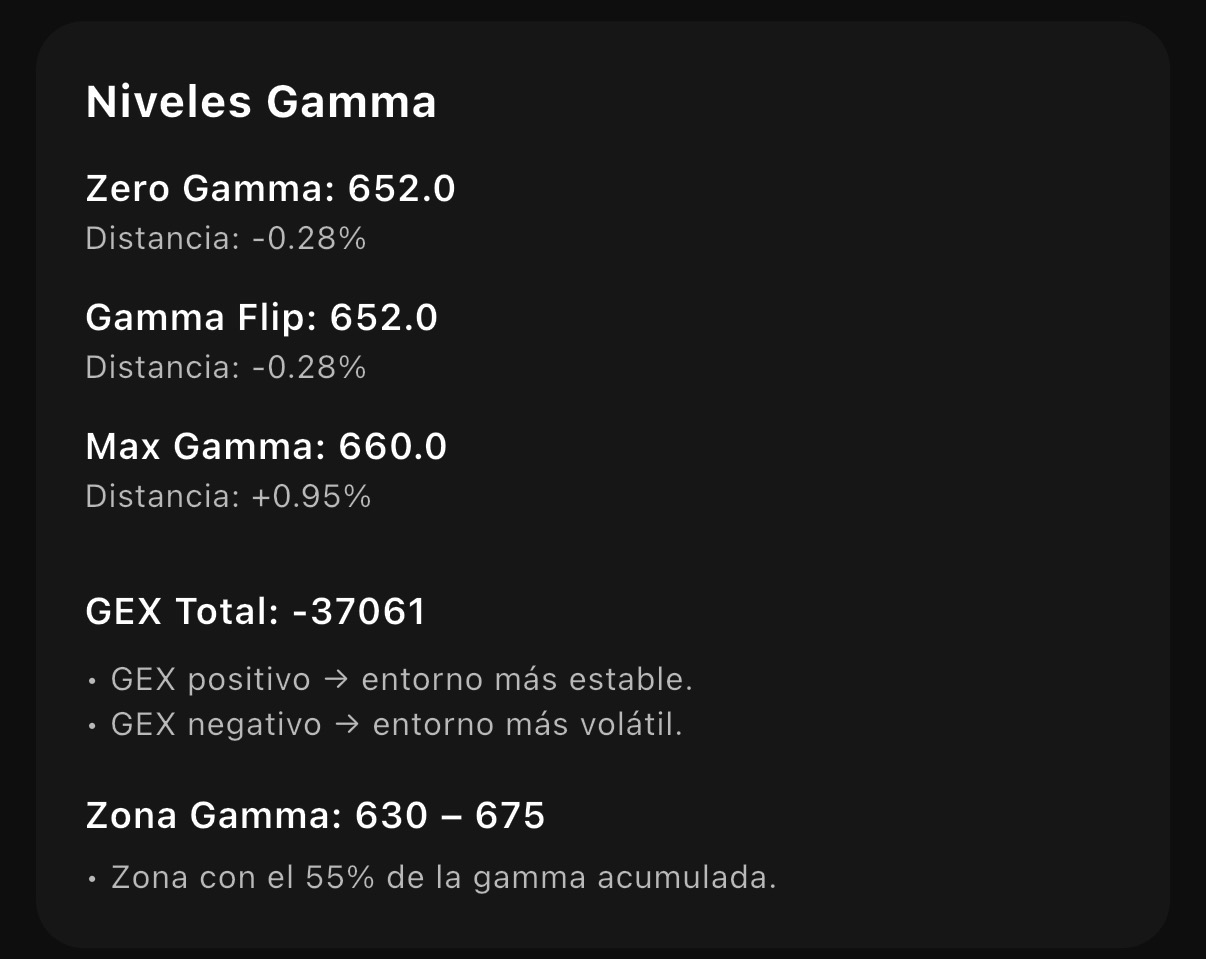
Gamma Levels
Zero Gamma · Gamma Flip · Max Gamma · Total GEX · Gamma Zone
Structural map of gamma exposure. Identifies the levels where market makers shift behavior, from absorption zones to acceleration zones.
- Gamma Flip: transition level between long and short gamma
- Max Gamma: strike with the highest move absorption
- Total GEX: reading of the market's volatility regime
★ Live Flow Plan
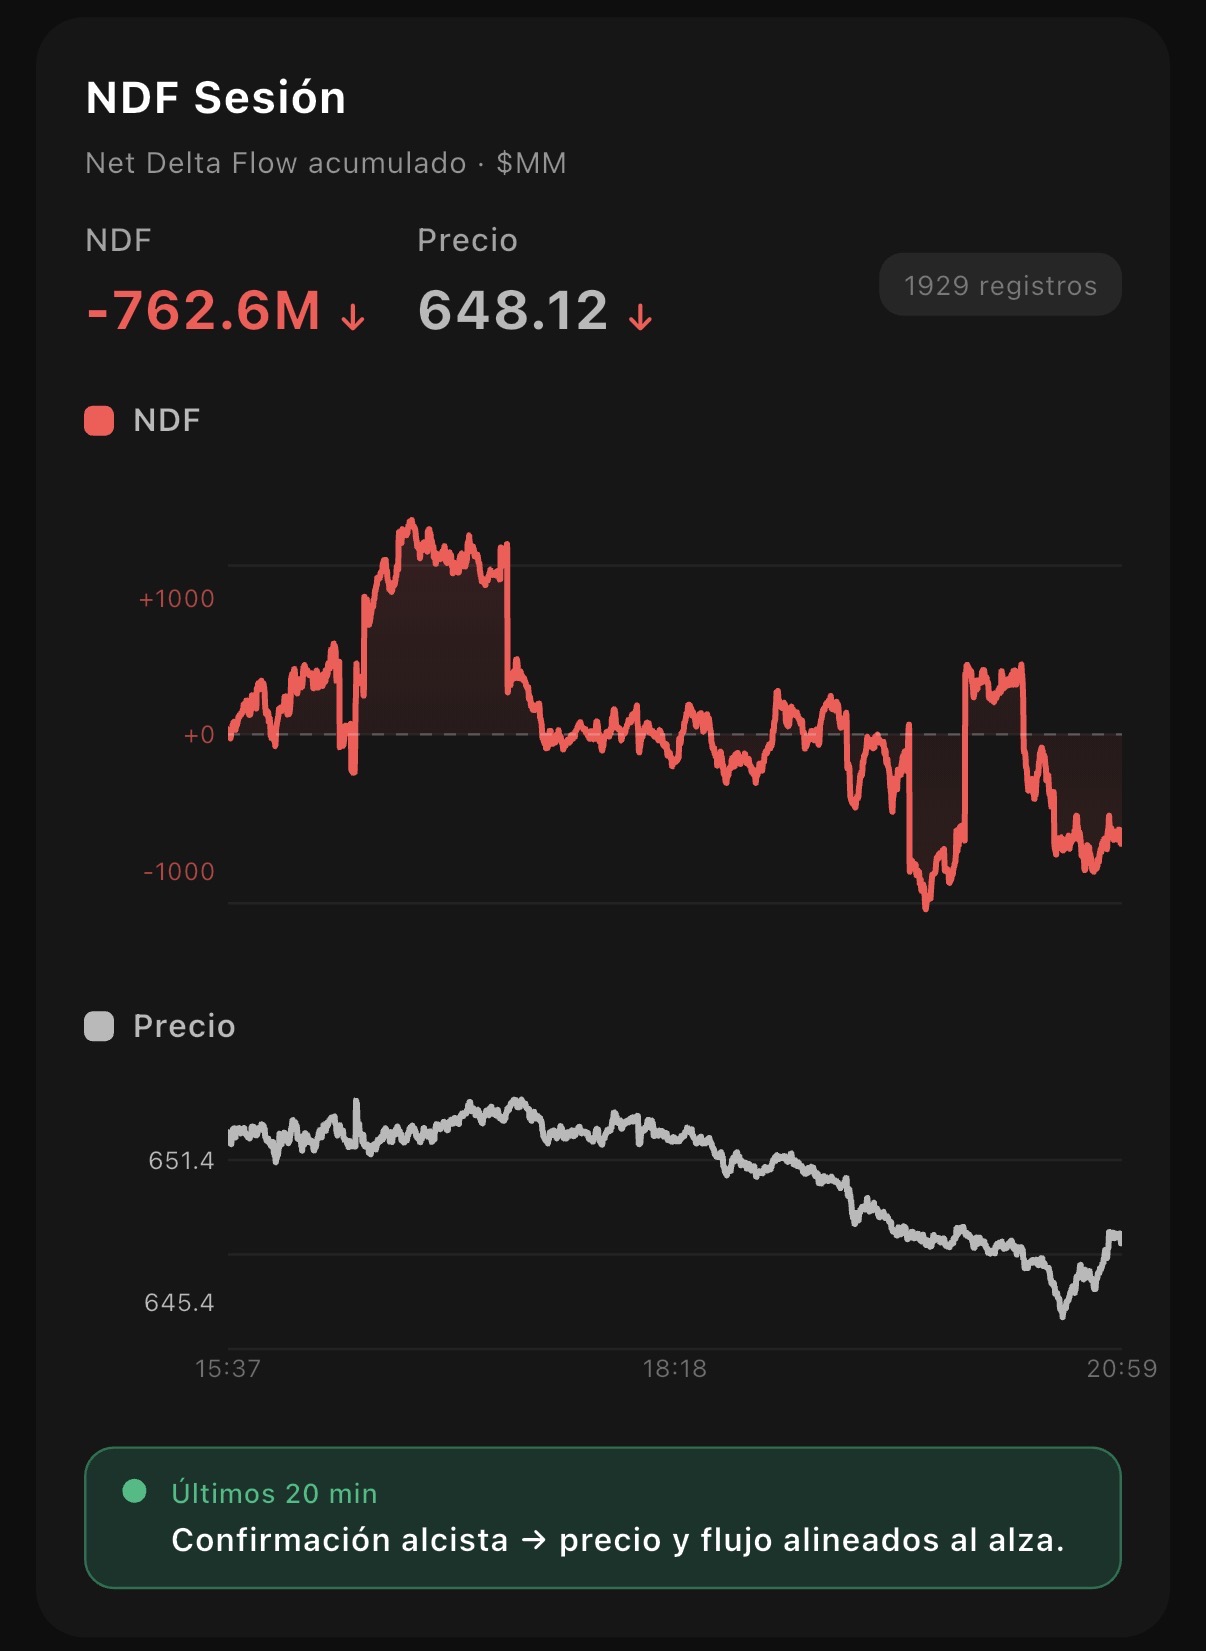
Net Delta Flow
NDF · Session net delta accumulation in $MM
Measures the net delta accumulated from options hedging during the session. When delta flow diverges from price, it anticipates reversals or accelerations before the chart confirms them.
- Net delta accumulation in $MM throughout the session
- Price–flow divergence detection to anticipate reversals
- Confirmation signal over the last 20 minutes
★ Exclusive to the Live Options Flow Analysis plan
Available on all plans
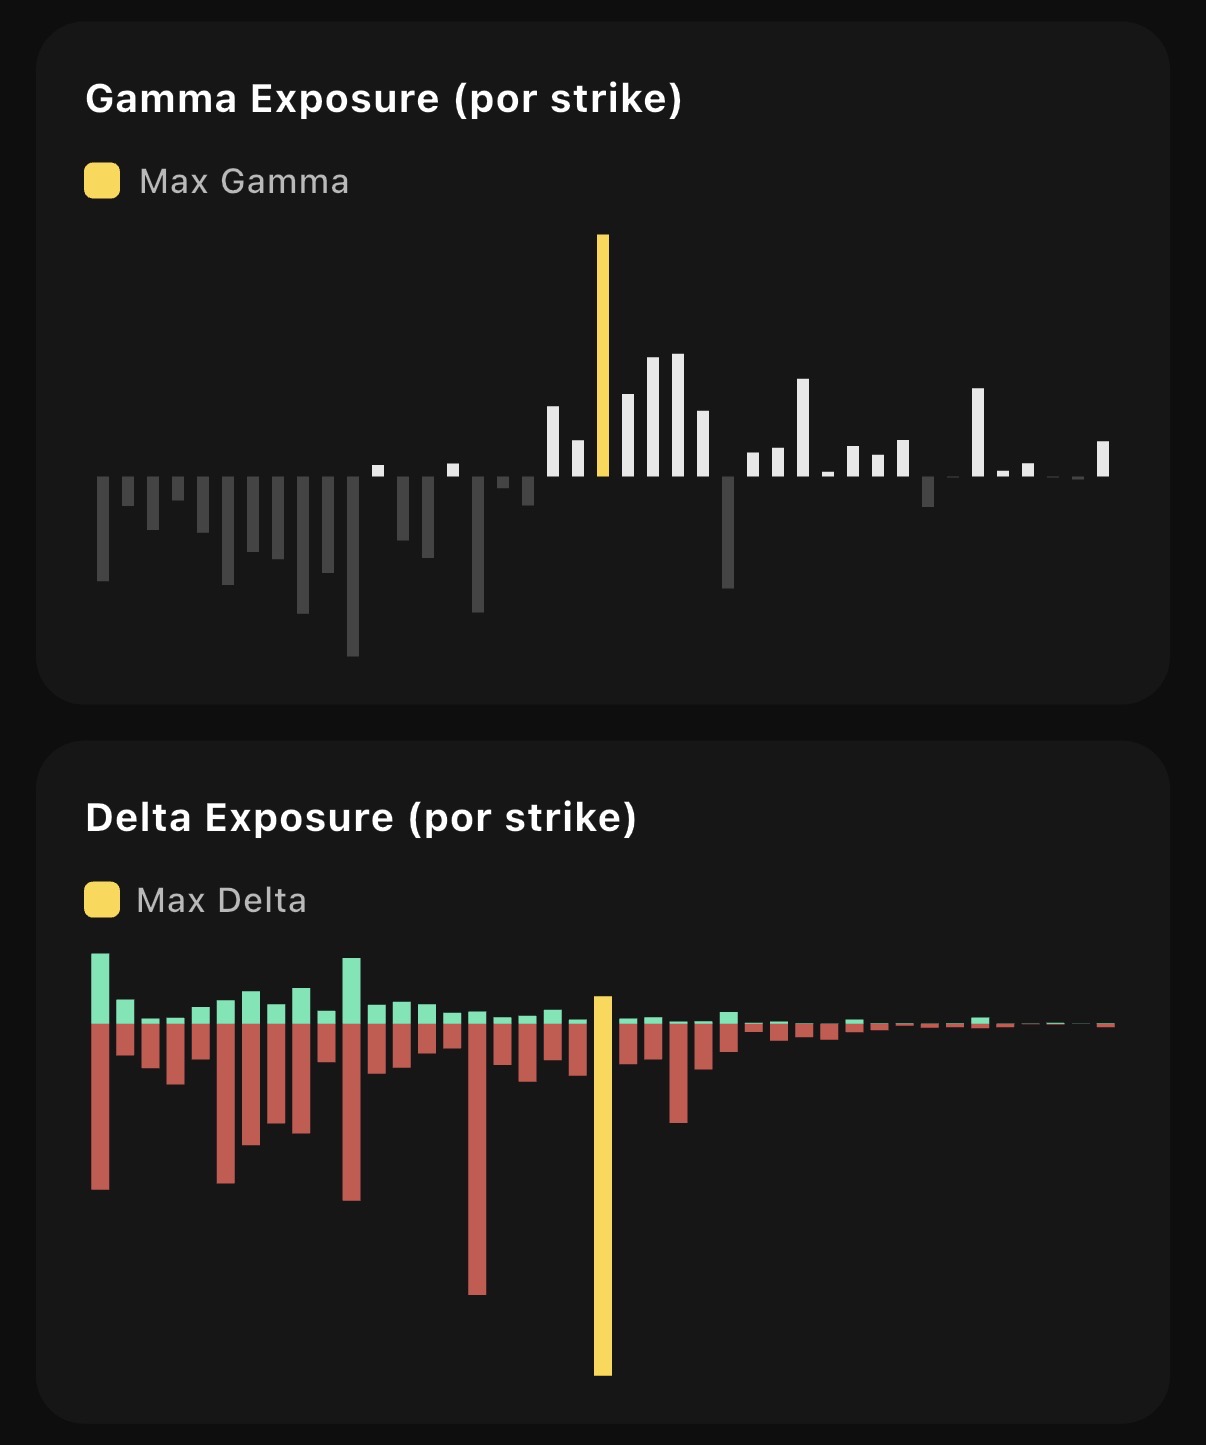
GEX & DEX
Gamma Exposure · Delta Exposure by strike
Strike-by-strike distribution of gamma and delta across the full chain. Identifies where market maker positions are concentrated and anticipates dynamic support, resistance or acceleration zones.
- GEX by strike: positive and negative gamma concentration
- DEX by strike: calls/puts balance with color coding
- Full coverage from deep OTM strikes to the most active
★ Live Flow Plan
Real-time data
Updated every 10–15 seconds · ThetaData Terminal
Full access to the entire U.S. options chain with minimum available latency. Live delta flow monitoring, gamma structure updated in real time and exhaustion signals before price confirms them.
- Full options chain updated every 10–15 seconds
- Continuous monitoring of institutional delta flow in real time
- Gamma structure, levels and dominance updated live
- ThetaData Terminal — minimum market latency provider
★ Exclusive to the Live Options Flow Analysis plan
Data infrastructure
Low-latency data
powered by
ThetaData
powered by
ThetaData
All indicators are powered by the full U.S. options chain via ThetaData Terminal, one of the lowest-latency options data providers available to active traders.
10–15s
Latency — Live Flow plan
2 min
Latency — Advanced Indicators plan
100%
U.S. options chain coverage
5+
Simultaneous flow and structure indicators
Platform under active development. Indicators and visualizations are continuously evolving. Interface changes, new features or data accuracy improvements may occur at any time. Any relevant updates are communicated to subscribers through the Discord server.
Frequently asked questions
What you need to know
What is Gamma Exposure (GEX)? ▼
GEX measures the net gamma exposure of market makers at each strike in the options chain. Positive GEX means dealers absorb price moves; negative GEX means they amplify them. It is one of the most widely used indicators to anticipate intraday market behavior.
What is Net Delta Flow (NDF)? ▼
NDF measures the net delta accumulated from options hedging activity during the session in real time. When delta flow diverges from price, it signals directional exhaustion before price confirms it — useful for detecting intraday reversals and inflection points.
How frequently is the data updated? ▼
The Live Options Flow Analysis plan updates every 10–15 seconds via ThetaData Terminal. The Advanced Indicators plan updates every 2 minutes with a 15-minute delay on the options chain.
Do I need to trade options for this to be useful? ▼
No. Market maker hedging generates real flows in stocks and ETFs that move price regardless of any conventional technical factor. Understanding gamma structure and delta flow is useful for any trader or investor operating in the U.S. market, regardless of the instrument they use.
What markets does the options chain cover? ▼
The data covers the U.S. options market including SPX, QQQ and individual stocks listed on NYSE and CBOE. Compatible with 0DTE options and multiple simultaneous expirations.
Access the data
Choose your plan
All plans include access to indicators, macro data and the U.S. options chain.
Advanced Indicators
Technical analysis & options
$7
per month · auto-renewal
GEX, DEX, gamma levels, PCR, IV, dominance and macro data. Options chain with a 15-minute delay.
Live Flow · Recommended
Real-time data
$20
per month · auto-renewal
Everything above plus Net Delta Flow (NDF). Updates every 10–15 seconds directly from the options chain with minimum latency.
⏳ Fixed price until May 5th